When I look at a company, I want to know if the business is healthy and whether the stock price makes sense beside that health. The financial statements are basically health report. Based on that you can make your bet on how market interpretation into a share price, pls note that I'm a long term investment not a trader
3 views of the same business: income statement, balance sheet, cash flow
The income statement is the scorecard. It shows revenue, expenses, and profit or loss over a period, such as a quarter or a year. Your personal version is annual salary minus living expenses.
The balance sheet is the snapshot. At one point in time, it shows what the company owns, what it owes, and the accounting value left for shareholders:
Assets = Liabilities + Shareholders' Equity
Assets can include cash, inventory, and equipment. Liabilities can include unpaid bills and debt. Equity is the accounting remainder after liabilities, not the company's stock market value.
The cash flow statement is the pulse check. It tracks cash moving in and out during the period. Profit on paper is useful, but cash pays the bills. In personal context, profit is what you earned while cash flow is what actually hit or left your bank account this month.
These 3 connect. Profit from the income statement contributes to equity over time. The cash flow statement explains why reported profit and the change in cash are not the same. The ending cash balance then appears on the balance sheet. For a quick review I start with these three, although a complete set of public-company statements also includes a statement of shareholders' equity, as the SEC's financial statement guide explains.
3 statement vs PE, PB, PS
3 common ratios give me a first comparison between market price and core business:
- Price-to-earnings, or P/E: how much investors pay for $1 of current earnings.
- Price-to-book, or P/B: market value relative to net accounting value.
- Price-to-sales, or P/S: market value relative to revenue.
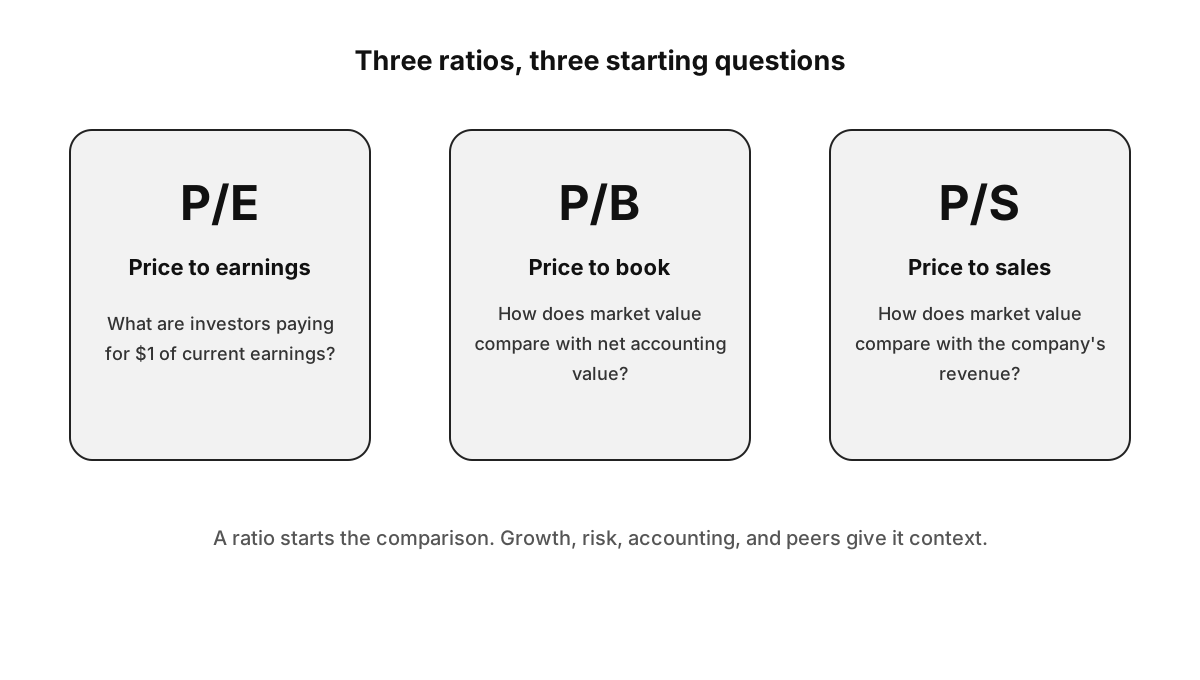 P/E, P/B, and P/S begin a comparison, but each ratio needs context from growth, risk, accounting, and similar companies.
None of them labels a stock cheap or expensive by itself. A ratio only becomes useful beside the company's growth, risks, accounting, and comparable businesses and depend on the market we may have a # of x per industry like VNINDEX or NASDAQ.
Evaluate the right share price to entry using relative value and intrinsic value
Relative valuation compares similar companies. Suppose Company A and Company B operate in the same industry and appear to have similar growth. Company A trades at a P/E of 15 while Company B trades at 30. Company A might be undervalued, or Company B might be overvalued.
There is also a less exciting possibility: the market expects Company A to grow more slowly or sees more risk in its earnings. The ratio points to the question. It does not answer it.
Ask yourself a question: what are the company's future cash flows worth today? A discounted cash flow model, estimates those cash flows and discounts them back to present value. This sounds more independent than comparing peers, but the output depends heavily on assumptions about growth, margins, risk, and the discount rate.
I see the 2 approaches as checks on each other. Relative valuation shows what the market pays for similar businesses. A discounted cash flow makes me write down what must happen for a price to make sense.